Predicting demand across a physical service network is fundamentally different from forecasting website traffic.
A digital platform can often scale its computing resources as traffic changes. A physical branch operates within harder constraints: a fixed number of counters, shift-based employees, different service categories and customers who must wait when capacity does not match demand.
In this environment, a forecasting error does not remain hidden inside an analytics dashboard. It becomes visible through longer queues, idle employees, missed service-level targets and inconsistent customer experiences.
Wavetec addresses this challenge through the AI-powered forecasting, simulation and optimization capabilities available within its Spectra Enterprise Customer Experience Platform. Spectra connects historical customer journey data with operational planning, helping organizations move from observing demand to preparing for it.
Contact Wavetec to explore AI-powered demand forecasting for your service network.
What Is Customer Demand Forecasting?
Customer demand forecasting is the process of using historical and current operational data to estimate how many customers are likely to visit a particular branch, service center or customer service location during a future period.
For a physical service network, a useful forecast should answer questions such as:
- How many customers are expected at each branch?
- Which days and hours are likely to experience peak demand?
- Which services will generate the highest volumes?
- How much variation exists between different locations?
- Where could available capacity fall below expected demand?
- How should staff and counters be distributed across the network?
Forecasting provides the expected demand. It does not automatically determine the best staffing or counter configuration. Those decisions require simulation and optimization, which use the forecast as an input.
In simple terms:
| Operational layer | Question answered |
| Forecasting | How many customers are expected? |
| Simulation | What is likely to happen under a particular staffing or service configuration? |
| Optimization | Which configuration is most likely to achieve the required service level? |
| Operational analytics | What is happening now, and how does it compare with the plan? |
This distinction is important. A forecast becomes valuable only when it is connected to an operational decision.
Why AI Forecasting Must Be Embedded in the Workflow
AI adoption has expanded rapidly, but enterprise-scale value remains uneven. McKinsey’s 2025 global survey found that 88% of respondents reported regular AI use in at least one business function, up from 78% in the previous year. However, only approximately one-third said their organizations had begun scaling AI across the enterprise.
McKinsey also found that nearly two-thirds of organizations remained in the experimentation or pilot stage. Its research identifies workflow redesign as an important characteristic of organizations achieving greater value from AI. Read McKinsey’s State of AI 2025 report.
For demand forecasting, this means that placing another prediction on a separate dashboard is not enough. Forecasts need to sit inside the tools used for:
- Queue monitoring
- Branch performance management
- Staffing and capacity planning
- Service-level management
- Appointment allocation
- Counter configuration
- Operational reporting
Wavetec’s approach is to make forecasting part of the Spectra operational environment, rather than treating it as an isolated data-science exercise.
The Data Reality: Forecasting Starts Before Model Selection
Every forecasting project begins with the same challenge: historical operational data is rarely ready for modelling.
Typical issues include:
- Missing or partially recorded operating days
- Duplicate transactions or queue tickets
- Inconsistent timestamps between branches
- Incorrect branch or service classifications
- Outliers caused by campaigns, outages or temporary closures
- New branches with limited historical information
- Changes in working days or opening hours
- Services that have been added, removed or redesigned
Poor-quality historical data can make a sophisticated forecasting model unreliable. In many cases, a well-structured dataset combined with a relatively simple model will outperform a more complex model trained on incomplete or inconsistent records.
Deloitte’s 2025 AI research supports this operational reality. It found that one in four organizations identified inadequate infrastructure and data as a barrier to AI returns. Deloitte also noted that organizations can overestimate their data maturity and encounter problems when proofs of concept are moved from controlled test data to real operational information. Read Deloitte’s analysis of AI investment and ROI.
Before forecasting begins, the data pipeline should therefore validate:
- Whether all expected operating days are present
- Whether transaction and ticket records are unique
- Whether timestamps use consistent formats and time zones
- Whether branch and service identifiers remain consistent
- Whether exceptional events should be corrected, excluded or retained
- Whether structural changes make older data less relevant
This preparation is not an administrative step. It is part of the forecasting system itself.
What Wavetec Forecasts
The primary forecasting variable is usually customer demand by branch and time period.
Depending on the operational decision, Spectra can work with different levels of granularity:
Daily Branch Demand
Daily demand estimates the number of customers expected at a branch on a given day. It is generally more stable than hourly forecasting and is useful for:
- Shift planning
- Short-term staffing decisions
- Branch capacity comparisons
- Leave and roster planning
- Regional resource allocation
Hourly or Intraday Demand
Hourly forecasts provide greater detail for within-day planning. They can help organizations:
- Identify opening-hour congestion
- Adjust breaks and shifts
- Open or close service counters
- Move employees between service categories
- Allocate appointment capacity
- Trigger operational alerts
The trade-off is that more granular forecasts also contain more noise. They require richer historical data and careful validation to avoid reacting to temporary fluctuations.
Demand by Service Type
Not all transactions require the same amount of time or expertise. Forecasting by service category can distinguish between:
- Short, standardized transactions
- Longer advisory interactions
- Priority or specialized services
- Appointment-based visits
- Walk-in traffic
This distinction allows the simulation layer to consider both customer volume and the operational complexity of the services being requested.
How the Spectra Forecasting Process Works
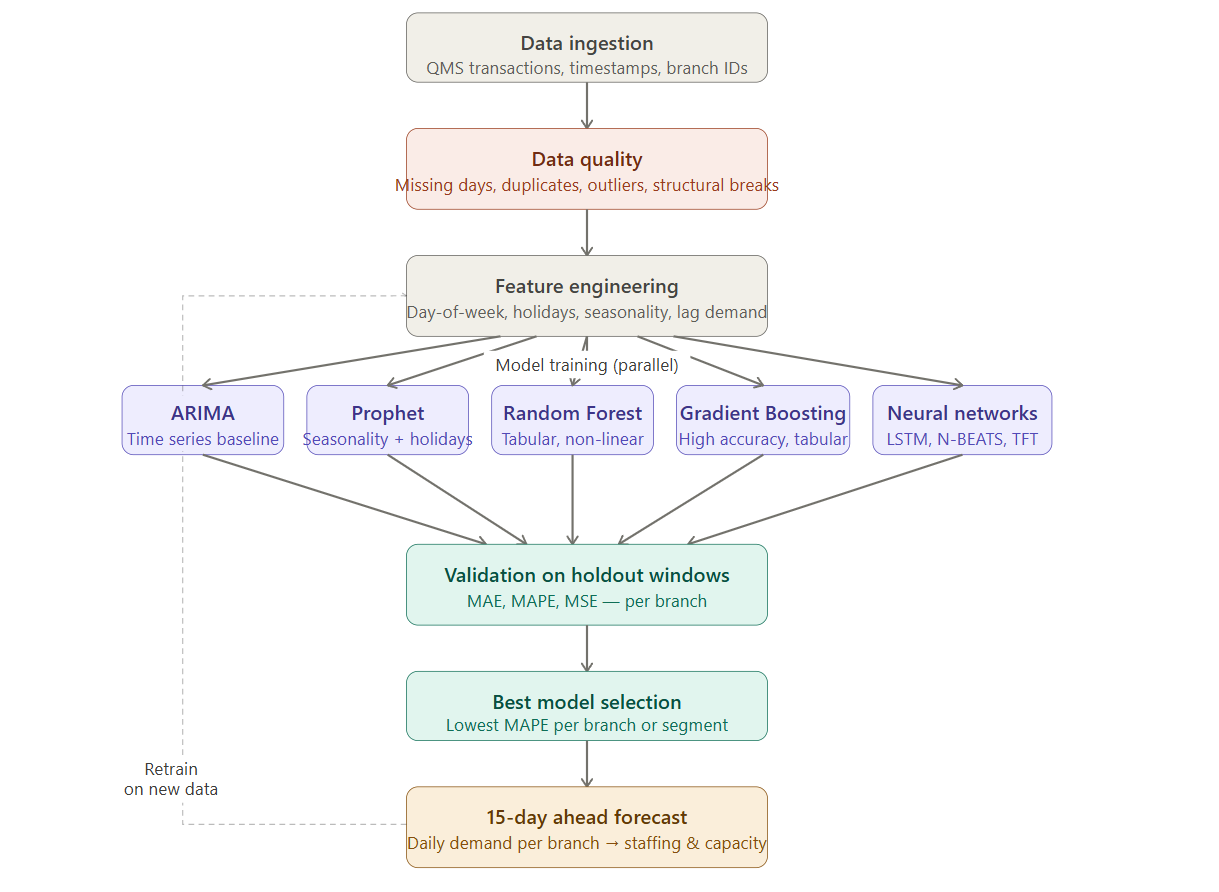
Wavetec’s forecasting workflow can be organized into six connected stages.
1. Capture Customer Journey Data
The Spectra Queue Management System records operational events throughout the customer journey, including:
- Ticket issuance
- Branch and service selection
- Customer arrival time
- Queue entry
- Counter call time
- Service start and completion
- Transfer between services
- No-shows and cancellations
- Waiting and service duration
Data can be generated through Wavetec’s ticket dispenser kiosks, Mobile-Q, WhatsApp Queuing, appointment channels, Web STU agent terminals and other connected touchpoints.
2. Validate and Structure the Data
The forecasting pipeline checks the completeness and consistency of historical records. Depending on the use case, the data can then be aggregated by:
- Branch
- Region
- Service
- Day
- Hour
- Customer category
- Appointment or walk-in journey
The platform can also incorporate approved calendar information, such as public holidays, special working days and known closures.
3. Generate Multiple Candidate Forecasts
No single forecasting model performs best across every branch.
A high-volume urban branch with several years of consistent history behaves differently from a new, smaller location with irregular demand. Wavetec can therefore evaluate multiple model families, including:
- ARIMA: A reliable statistical baseline for stable time-series patterns
- Prophet: Useful for recurring seasonality and irregular holiday calendars
- Random Forest: Suitable for nonlinear relationships within structured operational data
- Gradient Boosting: Often effective across diverse branch-level datasets
- LSTM: A neural-network architecture capable of learning longer temporal dependencies
- N-BEATS: A neural forecasting model designed for interpretable time-series decomposition
- Temporal Fusion Transformer: Suitable for richer, multi-variable forecasting contexts
Candidate models are evaluated against historical holdout periods rather than being selected solely because of theoretical sophistication.
4. Select the Most Reliable Model
The strongest model for a branch is selected using agreed performance measures. These can include:
- MAE — Mean Absolute Error: The average absolute difference between forecast and actual demand
- MSE — Mean Squared Error: A metric that gives greater weight to larger forecasting errors
- MAPE — Mean Absolute Percentage Error: The average error expressed as a percentage of actual demand
A lower error is preferable, but average accuracy is not the only consideration. Operational teams also need stability.
A model with an 8% average MAPE that fails unpredictably during particular weeks may be less useful than one that consistently remains close to 11% or 12%. For staffing decisions, predictable behavior can be more valuable than marginal gains in average accuracy.
5. Publish Forecasts to Spectra Dashboard
Forecast outputs are presented within the Spectra Dashboard, alongside real-time and historical queue information.
Authorized users can compare:
- Forecast demand against actual arrivals
- Expected and observed peak periods
- Branch-to-branch demand
- Service-category demand
- Waiting and service times
- Service-level attainment
- Customer no-shows and walkaways
- Staff and counter utilization
This keeps forecasting connected to the operational system already used by branch, regional and head-office teams.
6. Feed Forecasts into Simulation and Optimization
Forecasts become inputs for Wavetec’s simulation and optimization capabilities.
The platform can test alternative operating scenarios, such as:
- Adding or removing a service counter
- Moving an employee between branches
- Changing shift start and end times
- Reallocating staff between service categories
- Adjusting break schedules
- Shifting suitable demand toward appointments
- Changing priority and routing rules
Rather than testing these configurations in a live branch, teams can evaluate their projected effect on waiting times, staff utilization and service-level performance before implementation.
Which Features Matter Most?
Although forecasting systems can incorporate weather, local events and economic indicators, most branch-level predictive value often comes from a smaller group of dependable variables:
- Historical customer demand
- Day-of-week patterns
- Monthly and annual seasonality
- Public holidays
- Special operating dates
- Opening hours
- Branch and service characteristics
Additional external data should be included only when it improves validation results and can be maintained reliably.
Accenture’s research reinforces the importance of this data foundation. Based on more than 2,000 generative AI projects, it found that organizations creating enterprise-level value were 2.9 times more likely to have a comprehensive data strategy. Accenture also reported that only 36% of executives had scaled generative AI solutions, while just 13% said they were creating significant enterprise-level value. Read Accenture’s research on scaling AI.
The lesson for forecasting is clear: operational value depends less on adding more models and more on creating a reliable data and decision architecture.
A 60+ Branch Government Service Deployment in the UAE
One of Wavetec’s more demanding forecasting deployments involved a government service network operating across more than 60 locations in the United Arab Emirates.
The network included:
- Shift-based operations
- Branches with substantially different customer volumes
- Multiple services that were not uniformly available at every location
- Smaller and newer branches with limited history
- Weekly demand patterns influenced by the regional working calendar
The requirement was to generate daily branch-level forecasts for the next 15 days to support short-term staffing and capacity planning.
Instead of applying a single model across the network, the forecasting process evaluated branch behavior individually. This made it possible to account for differences in demand volume, stability and service mix.
Across the deployment, forecast performance generally remained within a 5% to 15% MAPE range, depending on branch size and demand stability. Higher-volume branches with consistent historical patterns generally performed toward the lower end of the range.
Forecasts were integrated into Spectra Dashboard so planners could view predicted demand in the same operational environment used for real-time queue monitoring and historical reporting.
From Forecast Accuracy to Operational Outcomes
Forecasting should ultimately be measured by the decisions it improves.
In a Wavetec pilot covering 12 bank branches, the baseline service level—the percentage of customers attended within the target waiting time—was 52%. The operational objective was 85%.
The process involved:
- Generating branch-level demand forecasts
- Running more than 95,000 staffing simulations
- Identifying over- and under-allocation between locations
- Testing different resource configurations
- Reallocating six tellers across the network
The resulting plan produced a 26% improvement in service level without adding headcount. The improvement came from allocating existing capacity more effectively.
The time required to create the staffing plan also decreased from approximately three days of manual work to around ten minutes.
Additional Wavetec pilot analysis found that, in some environments, 52% of daily tickets were issued within the first operating hour. This concentrated demand created a disproportionate waiting-time spike.
Simulated load-flattening interventions, including appointment-based redistribution, indicated:
- Potential waiting-time reductions of up to 70% during the opening-hour peak
- Projected average waiting-time reductions of approximately 24% across broader daily and weekly patterns
These results demonstrate the difference between a forecasting model and a complete operational decision system.
Spectra: More Than a Forecasting Dashboard
Spectra provides the central software layer for Wavetec’s customer journey management ecosystem.
Its capabilities include:
Real-Time Queue Management
Spectra tracks customers across ticketing, waiting, service, transfer and completion events. Configurable routing rules can direct customers according to service, priority, appointment status or customer profile.
Centralized Configuration
Head-office teams can manage service categories, queue rules, users, templates and performance thresholds across multiple locations.
Dashboards and Historical Reporting
Spectra provides real-time and historical visibility into branch, regional, service and employee performance. Configurable alerts can notify teams when waiting times or other service indicators exceed defined thresholds.
AI Demand Forecasting
The forecasting layer uses historical operational data, seasonality and approved calendar variables to estimate future demand by branch and period.
Simulation and Optimization
Forecasts feed scenario modelling tools that can evaluate staffing, capacity and service configurations before they are implemented.
AI Analytics Assistant
An embedded AI assistant can help authorized users explore operational data through natural-language questions, such as:
- Which branches are expected to exceed capacity next week?
- Which service generated the longest waiting time yesterday?
- Where is actual demand exceeding the forecast?
- Which staffing configuration is projected to meet the target service level?
The assistant supports analysis; authorized managers retain control over operational decisions.
Integration Architecture
Spectra can exchange journey and operational data with approved third-party platforms through APIs and integration services. This can include appointment platforms, customer databases, CRM systems, mobile applications and organizational reporting environments.
Enterprise Governance
Depending on the approved deployment architecture, Spectra can support:
- Role-based access control
- Audit logging
- Centralized user and configuration management
- Encrypted communication
- Data retention policies
- Multi-site governance
- On-premises, cloud or hybrid deployments
- System and device monitoring
These controls are important when forecast data influences staffing, service prioritization or other operational decisions.
Where Forecasting Models Break
Forecasting systems should be designed around their limitations rather than presented as universally accurate.
Low-Data Branches
Branches with limited history can produce unstable forecasts. Possible approaches include:
- Hierarchical models that learn from comparable branches
- Pooled data across similar locations
- Minimum-data thresholds
- Simpler statistical baselines
- Manual planning rules until sufficient data is available
Structural Differences Between Locations
A high-volume branch providing standardized services behaves differently from a branch with lower volume and a varied service mix. Model selection and validation should therefore occur at the branch or segment level.
External Shocks
System outages, new regulations, marketing campaigns, temporary closures and major events are difficult to predict from historical patterns alone.
The forecasting workflow should include:
- Manual override controls
- Event annotations
- Exceptional-calendar inputs
- Reforecasting after structural changes
- Alerts when actual demand departs materially from the forecast
New or Redesigned Services
Historical patterns become less relevant when the operating model changes. Forecasting systems need to identify structural breaks and determine whether older data should be retained, weighted differently or excluded.
Accuracy Without Interpretability
A marginally more accurate black-box model may not be the best operational choice if planners cannot understand or trust its behavior.
Model selection should balance:
- Accuracy
- Stability
- Interpretability
- Maintainability
- Data requirements
- Operational risk
The best model is not necessarily the most sophisticated. It is the model that remains dependable under the conditions in which decisions must be made.
Similar Wavetec Multi-Branch Deployments
Wavetec’s experience with centralized customer journey management extends across large banking, postal, government and service networks.
Banorte deployed Wavetec’s Customer Flow Management Solution across more than 1,000 branches in Mexico. The integrated environment combines customer identification, priority routing, digital signage and centralized dashboards. Banorte’s operational teams use real-time and historical data to monitor branches and adjust calling logic as customer inflows change.
Swiss Post implemented Wavetec’s customer journey solution across 139 branches. The deployment includes Lobby Leader, a centralized cloud engine, a dashboard management portal, web ticketing, QR scanning, WebSDU and API integrations with Swiss Post’s app and teller software.
These projects demonstrate how a centrally managed platform can connect branch operations, real-time journey data, integrations and decision support across distributed service networks.
What This Means for Service Operations
Effective demand forecasting is not about identifying one universally superior algorithm.
It is about creating a reliable chain from operational data to action:
- Capture consistent customer journey data
- Validate and structure the historical record
- Compare multiple models
- Select the most reliable model for each context
- Publish forecasts inside the operational platform
- Simulate alternative staffing and service configurations
- Implement approved changes
- Compare actual results with the forecast
- Continuously retrain and improve the system
Forecasting tells an organization how much demand may arrive. Spectra connects that prediction to the decisions that determine what customers actually experience.
Frequently Asked Questions
What is AI customer demand forecasting?
AI customer demand forecasting uses historical and current operational data to estimate future customer volumes by branch, service or time period. The forecasts can support staffing, capacity and appointment-planning decisions.
What data does Wavetec Spectra use for forecasting?
Depending on the deployment, Spectra can use historical ticket volumes, arrival times, service categories, waiting and service durations, branch calendars, operating hours, seasonality and public holidays. Additional approved variables can be included when they improve forecast performance.
Which forecasting model does Wavetec use?
Wavetec does not rely on one model for every branch. Candidate approaches can include ARIMA, Prophet, Random Forest, Gradient Boosting, LSTM, N-BEATS and Temporal Fusion Transformer. Models are evaluated against historical holdout data and selected according to accuracy, stability and operational suitability.
How accurate is branch demand forecasting?
Accuracy varies according to data quality, branch size, demand stability and forecast horizon. In the 60+ branch UAE deployment described in this article, typical MAPE ranged from approximately 5% to 15%.
Does demand forecasting automatically create staff schedules?
Forecasting estimates expected demand. Staffing recommendations require simulation and optimization layers that evaluate different shift, counter and resource configurations against the forecast.
Can Spectra forecast hourly demand?
Yes. Forecasting can be performed at daily or intraday levels when sufficient historical data is available. Hourly forecasting provides greater planning detail but can introduce more variability.
Can managers override an AI-generated forecast?
Operational deployments should include authorized override mechanisms for known events such as campaigns, closures, regulatory changes or outages that may not be represented in historical data.
How does Wavetec govern access to forecasting data?
Depending on the approved system configuration, Spectra can use role-based access control, audit logs, centralized user management, encrypted communication and defined data-retention policies.
Turn Forecasts into Operational Decisions
Every forecast in a physical service network has a real-world consequence. It can influence how many employees are available, which counters open, how appointments are distributed and how long customers wait.
Wavetec’s Spectra platform connects Queue Management, AI demand forecasting, simulation, optimization, centralized dashboards and operational analytics within one enterprise customer experience ecosystem.
Contact Wavetec to learn how predictive branch analytics can support better staffing, stronger service-level performance and more consistent customer journeys.
BOOK A FREE DEMO