


Delta Air Lines Continues Its Trust in Wavetec for Premium Lounge Customer Journey Management
August 7, 2026
Commercial Bank International Deploys Wavetec Spectra QMS Across Six UAE Branches
August 18, 2026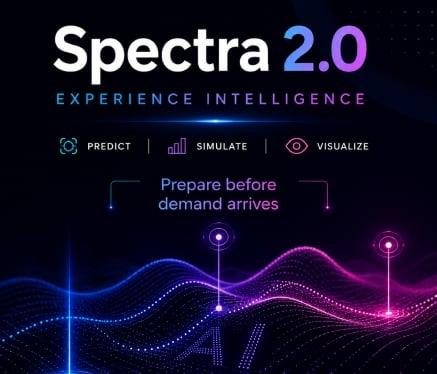
Wavetec Launches Spectra 2.0: From Queue Monitoring to Predictive Customer-Flow Operations
Wavetec has launched Spectra 2.0, a new operational-intelligence foundation for organizations managing customer flow across branches, hospitals, government service centres, telecom stores and other physical service environments.
Spectra 2.0 extends Wavetec’s queue management and customer-experience platform beyond historical reporting. It brings together live operational analytics, machine-learning-based demand forecasting and discrete-event simulation so organizations can understand what is happening now, anticipate future demand and test operational changes before implementing them.
The objective is straightforward:
Help service organizations prepare for demand before the customer arrives—and test the consequences of operational decisions before customers experience them.
Spectra 2.0 is also the foundation for Wavetec’s wider enterprise AI roadmap. Over the coming weeks, Wavetec will introduce Nexia, more soon to come.
The launch builds on Wavetec’s global footprint of more than 30,000 deployed systems across over 80 countries, supported by regional offices in NYC, Mexico City, Lima, London, Barcelona, Dubai, Riyadh, Nairobi, Karachi, Beijing and Tokyo. Wavetec’s customer-flow and experience platforms power some of the world’s largest service networks, including more than 1,200 Banorte branches in Mexico, DriveTest DMV Ontario over 90 branches, 1,300 + branches for UBL, Swiss Post 234 branches, 278 BBVA branches in Peru, and over 500 AlRajhi Bank branches in Saudi Arabia.
Across banking, government, healthcare, and telecommunications, Wavetec brings together proprietary hardware, enterprise-grade software, advanced analytics, and end-to-end integration and deployment services, providing a field-proven foundation for the predictive customer-experience capabilities introduced with Spectra 2.0.
This direction reflects a wider transformation in customer experience. McKinsey’s article, “Next best experience: How AI can power every customer interaction,” describes how integrated data, predictive models, and decision orchestration can help organizations deliver the right interaction at the right time and place. Similarly, BCG’s “How Customer Experience Is Changing Across Industries in the Age of AI” highlights the competitive value of customer experiences that are proactive, predictive, and personalized.
What is Spectra 2.0?
Spectra 2.0 is Wavetec’s operational-intelligence platform for monitoring, forecasting and simulating customer flow.
It combines four complementary capabilities:
| Capability | Question it answers | Operational value |
| Live Branch Summary | Where is a problem developing right now? | Gives central teams a network-wide view of queues, service levels and branch availability |
| Branch Waiting Dashboard | Why is the problem occurring? | Separates arrival pressure, service-time issues, routing failures and underused capacity |
| AI Traffic Forecasting | How much demand should we expect? | Predicts ticket volumes and demand patterns for staffing and capacity planning |
| Inflow Simulation | What will happen if we change the operation? | Tests counter numbers, staffing, routing, capacity and service configurations before deployment |
The progression is important:
Live analytics observes. Forecasting anticipates. Simulation tests.
Why customer-flow operations need more than a dashboard
Physical service operations have a structural challenge: their most expensive resource—staffed service capacity—is committed before demand is known.
A branch manager must decide how many counters to open, which service skills to make available and when to schedule breaks before the day’s customers arrive. If too much capacity is scheduled, the organization pays for idle time. If too little is scheduled, customers experience longer waits, service-level breaches and abandonment.
Traditional reports normally reveal the problem after it has occurred. Even live dashboards can only show that a queue is already forming.
Spectra 2.0 moves the decision earlier:
- Live dashboards reduce the time between a service problem occurring and management seeing it.
- Forecasting estimates the demand that the operation should prepare for.
- Simulation shows how that demand is likely to behave under a particular operational configuration.
This reflects a wider movement from passive analytics toward AI-supported frontline operations. BCG describes this direction as connecting demand forecasting, labour decisions and operational workflows without requiring organizations to replace their entire technology environment. BCG Frontline Ops AI
One operational source of truth
Every Spectra 2.0 metric begins with the same customer ticket lifecycle.
A ticket is issued, waits, is called, begins service and eventually reaches a terminal state such as served, cancelled or no-show. A transferred ticket is returned to the waiting flow rather than treated as a completed journey.
The platform records four governing timestamps:
- Ticket issue time
- Ticket call time
- Service start time
- Service end time
From these timestamps, Spectra calculates:
Waiting time = ticket call time − ticket issue time
Service time = service end time − service start time
Waiting-time and service-time targets can be configured by branch and service category. A teller transaction can therefore have a different target from an account-opening or advisory service.
The live dashboards, historical reports and forecasting pipeline use the same operational records. This matters because forecast validation must reconcile with the volumes that managers previously saw in live operations. Spectra does not create a separate analytics truth that conflicts with the underlying queue data.
Live Branch Summary: seeing the network as it operates
The Live Branch Summary is designed as a command centre for regional and central operations teams.
Each authorized user sees only the branches and regions permitted by their role. Branch scope is resolved on the server before the data is aggregated, rather than being filtered only in the browser.
The interface brings together:
- Branch connectivity and heartbeat status
- Tickets issued, waiting, serving and served
- Average and maximum waiting time
- Average and maximum service time
- Waiting-time and service-time compliance
- Active counters versus configured counters
- No-show, cancellation and transfer exceptions
A branch reporting no data is clearly separated from a branch reporting no demand. This prevents an offline location from appearing to be a quiet, well-performing branch.
The dashboard uses a configurable polling interval and displays its last-update time. This gives operational users an explicit freshness indicator instead of leaving them to assume that the screen is live.
For large deployments, the network summary is generated through scoped aggregation rather than a separate query for every widget and branch. Drill-down distributions are calculated only when a user opens the relevant branch.
Branch Waiting Dashboard: understanding why performance is changing
A network-level KPI can show which branch requires attention, but it cannot explain the cause.
The Branch Waiting Dashboard decomposes performance across four levels:
- Headline waiting-time, transaction-time and service-level indicators
- Queue pressure, counter utilization and service-recovery ratios
- Waiting-time and service-time distributions
- Individual operator, service-category and ticket-level detail
This distinction prevents misleading conclusions.
For example, a branch can have an acceptable average waiting time while still producing a small number of extreme waits that generate complaints. Spectra therefore presents average and maximum values together and divides waiting customers into configurable age bands.
The operator view separates logged-in time into:
- Time serving customers
- Time performing backend activities
- Idle time
This helps management distinguish between insufficient staffing and underused existing capacity.
A branch with high queue pressure and low counter utilization does not necessarily need more employees. It may need existing counters to open earlier, different skill assignments or improved routing. High pressure with already-high utilization indicates a more genuine capacity or process constraint.
AI Traffic Forecasting: preparing for demand
Spectra 2.0’s forecasting engine estimates operational ticket volume at daily, weekday-profile and annual levels.
The standard model uses a rolling three-year history enriched with configurable environmental and calendar events, including:
- Day-of-week and month-of-year seasonality
- Public and religious holidays
- Payroll, tax and government-disbursement dates
- Regional events and closures
- Severe weather or access disruption
- Changes to branch hours, capacity or services
This external context matters because the highest-impact operating days are frequently caused by events that cannot be inferred from ticket history alone.
Local events are managed through configuration rather than embedded in the model. A deployment in Dubai, Karachi, Barcelona or Lima can therefore maintain the relevant local calendar without requiring the forecasting software to be rewritten.
The forecasting interface publishes the prediction together with its historical performance:
- MAE: the typical daily error measured in tickets
- RMSE: an error measure that gives greater weight to large misses
- MAPE: the average percentage error
- Reliability: a business-facing representation of forecast confidence
This is an important governance principle: users should not receive a forecast without also seeing how the model has performed against actual demand.
A decoupled forecasting architecture
The forecasting engine is separated from the operational Spectra application.
This protects live queue operations from the CPU- and memory-intensive model-training workload and allows the forecasting model to be upgraded independently of the dashboard.
The current architecture includes:
- Scheduled extraction from the Spectra operational database
- Audited SFTP-based ingestion for restricted enterprise environments
- Normalization of time zones, units, branch IDs and service categories
- Filtering of duplicates, test tickets and impossible durations
- A dedicated prediction database
- Automated model retraining on a monthly cycle
- Precomputed forecasts for low-latency dashboard access
- Separate forecast and historical-validation endpoints
- An authenticated API gateway with payload validation and rate limiting
The data flow into forecasting is unidirectional. The forecasting backend reads operational history but does not write into the live queue database. A forecasting outage therefore affects predictive functionality without interrupting live queue management.
For a reference 100-branch deployment, the current technical specification sizes the forecasting backend at a minimum of eight CPU cores and 32 GB of RAM, with final requirements determined by data volume, model complexity and deployment architecture.
Inflow Simulation: testing tomorrow before changing the operation
Forecasting and simulation answer different questions.
A forecast estimates how many customers may arrive. A simulation determines what is likely to happen to those customers inside a specific operating configuration.
The Inflow Simulation module—presented within Spectra as the Operations Engine—allows planners to configure:
- Target branch and operating hours
- Physical waiting-area capacity
- Number of installed and active service positions
- Hour-by-hour arrival demand
- Service categories and service-level targets
- Average service time and service-time variability
- Counter clusters and service-routing priorities
- Branch flow from arrival to ticketing, waiting, service and exit
The demand profile can be entered manually for a hypothetical event or synchronized with the AI forecast.
This creates an operational digital representation of the service environment. It is not simply a visual animation: it is a probabilistic model of customer arrivals, service durations, routing constraints, physical capacity and available resources.
Deloitte identifies discrete-event simulation as a method for representing complex systems—including customer-service queues—as time-ordered events so organizations can test how the system behaves under different resource constraints and operating rules. Deloitte, “From manufacturing to medicine: How digital twins can unlock new industry advantages”
The mathematics behind the simulation
The simulation uses three central modelling principles.
-
Poisson arrival processes
Hourly demand is converted into a customer-arrival rate. Inter-arrival times are sampled from an exponential distribution.
Because the rate can change every hour, the simulator can reproduce an opening-hour surge or midday peak instead of spreading the day’s demand evenly across the operating period.
-
Lognormal service-time distributions
Service times cannot be accurately represented by a symmetric normal distribution. They cannot be negative, and actual service activity usually contains a long right-hand tail: most transactions complete near the typical time, while a smaller number take considerably longer.
Spectra therefore models service duration using lognormal distributions calibrated from the measured mean and variability of each service category.
-
Monte Carlo replication
One simulated day is only one possible realization. The current engine executes 50 independent trials of the same configuration and averages the operational results.
Maximum waiting time is treated more conservatively: the engine retains the worst maximum observed across the trials rather than averaging away a potentially important failure condition.
What can simulation reveal that a report cannot?
A reference simulation described in the Spectra 2.0 technical specification tested a high-demand profile against a branch configured with 20 counters but only 15 active tellers.
Across the simulated day:
- 1,733 customers arrived
- 850 customers were served
- 832 customers left after physical capacity was reached
- 50 customers remained waiting at closing
- One customer remained in service
- Approximately 48% of arrivals were not served
- Aggregate teller utilization was approximately 76%
This result demonstrates why utilization alone can be misleading.
The branch did not fail simply because every teller was continuously busy. Potential causes included undeployed counters, rigid service clusters that prevented idle counters from supporting congested services, and a waiting-area capacity that rejected new arrivals once the floor was full.
Each explanation can be isolated through a new simulation:
- Increase active tellers and rerun
- Pool or remap service clusters and rerun
- Increase physical waiting capacity and rerun
- Modify the hourly roster and rerun
Historical reports cannot directly evaluate these alternatives because the proposed configurations have never operated in the real branch.
The figures above are a reference simulation, not a claim about a customer deployment. Actual results depend on each organization’s demand, service mix, operating policies and configuration.
Building on Wavetec’s installed customer-flow foundation
Spectra 2.0 builds on Wavetec’s existing queue management, appointment, virtual queuing, self-service, digital-signage and customer-feedback ecosystem.
Wavetec’s public case studies demonstrate the scale of that foundation:
- Banorte deployed Wavetec customer-flow technology across more than 1,000 retail branches in Mexico, including centralized reporting and dashboards. Banorte case study
- BBVA Peru’s cloud-based Wavetec deployment spans 278 branches. The published case study reports an approximately 35% reduction in average waiting time, a 57% reduction in abandonment and 99.93% availability. BBVA Peru case study
- Banque Saudi Fransi deployed Wavetec solutions across more than 100 branches, combining queue management, digital signage, feedback and centralized live reporting. Banque Saudi Fransi case study
These results relate to their respective deployments and should not be interpreted as guaranteed outcomes for every Spectra 2.0 implementation.
Spectra 2.0 establishes the foundation for Wavetec’s enterprise AI roadmap
AI performs best when it has governed access to structured and operationally meaningful data.
Spectra 2.0 establishes that foundation by providing:
- A consistent customer-flow event model
- Reconciled operational metrics
- Configurable service-level targets
- Forecasts with published accuracy
- Simulation tools for controlled experimentation
- Role-based access and branch-level data boundaries
- Auditable operational evidence
Over the coming weeks, Wavetec plans to introduce the Nexia family in stages. More to come.
Enterprise control and responsible deployment
Spectra 2.0 is designed for enterprise environments where operational continuity, access control and data boundaries are essential.
Core controls include:
- Server-side branch and region authorization
- Authenticated API access
- Rate limiting and payload validation
- Separation between live operations and model training
- Idempotent data ingestion
- Historical forecast-versus-actual validation
- Configuration ownership for local events and service targets
- Failure isolation between observational and predictive services
Forecasts should support operational judgement rather than replace it. Daily forecasts will normally contain more uncertainty than monthly or annual aggregates, and newly opened or materially changed branches require additional calibration.
Frequently asked questions
What is Spectra 2.0?
Spectra 2.0 is Wavetec’s operational-intelligence platform for live customer-flow analytics, AI demand forecasting and branch simulation. It helps organizations understand present performance, prepare for future demand and test operational configurations before implementing them.
What is the difference between forecasting and simulation?
Forecasting predicts how many customers are likely to arrive. Simulation uses that demand to test what may happen under a specific combination of staffing, counters, service times, routing rules and physical capacity.
Is Spectra 2.0 based on a generative AI model such as ChatGPT?
Its core calculations are not dependent on a large language model. Demand forecasting uses machine-learning models, while the Operations Engine uses discrete-event simulation, probabilistic arrival and service-time distributions, and Monte Carlo replication. Generative AI will be used in separate Nexia capabilities.
How is forecast accuracy measured?
Spectra publishes MAE, RMSE and MAPE, together with actual-versus-predicted comparisons. Accuracy should be monitored over time and interpreted according to branch volume, forecast horizon and event coverage.
Can Spectra 2.0 simulate a branch that does not yet exist?
Yes. Planners can manually define expected demand, service categories, counter capacity, routing and physical constraints for a proposed branch or service model. Because no historical branch profile exists, the quality of the result depends on the assumptions supplied.
Does simulation automatically choose the best staffing plan?
The current simulation evaluates a configuration supplied by the planner. It allows alternatives to be compared, but it should not be presented as an autonomous optimizer unless an optimization capability has been formally implemented and released.
Can Spectra 2.0 support on-premises environments?
The architecture supports customer-controlled enterprise deployment patterns, including environments that use audited file transfer instead of direct cross-boundary database access. Infrastructure, security and integration requirements should be confirmed during solution design.
Prepare for demand before it becomes a queue
Customer-flow operations should not have to wait for congestion, abandonment or an SLA breach before taking action.
Spectra 2.0 brings live visibility, predictive analytics and operational simulation into one governed environment—helping organizations see what is happening, understand why it is happening and test what should change next.
Talk to a Wavetec expert to discuss Spectra 2.0, enterprise deployment options and predictive customer-flow planning.